Wasatch Back Market Report · Q3 2026
Fewer homes.
Sharper choices.
The latest real estate numbers for Park City, Snyderville Basin, Jordanelle, Heber Valley and East Summit County, and what they mean if you're buying or selling.
The big story: far fewer homes coming to market
The biggest change on the Wasatch Back this year was in supply, not price. Only 81 single-family homes came to market in Park City over the past 12 months, down from 138 the year before. That’s a 41% drop in new listings.
The drop isn't limited to Park City. New single-family listings fell in all five areas we track, from 19% in Snyderville Basin to 52% in Jordanelle.
New single-family listings by area
Year over year
For sellers, fewer competing listings means your home gets more attention. For buyers, it means less to choose from, so being ready when the right home appears matters more than it used to.
Prices: a mixed picture by area
Prices didn't move together. Snyderville Basin was the standout. The median single-family price rose 9% to $2.70M, sales rose 8%, and total sales volume passed $1.6 billion.
Rolling 12 months ending 9/30/26 vs. the same period a year earlier. Source: Park City Board of Realtors MLS.
Elsewhere, medians eased. Park City was down 7% to $3.80M, Jordanelle down 8% to $3.88M, Heber Valley down 4% to $1.04M, and East Summit County down 11% to $810K. Lower prices didn't mean a slower market everywhere, though. Jordanelle sold 20% more homes than last year, and East Summit County sold 6% more.
Medians can swing with the mix of homes that sell in a given year. That's why we look at each neighborhood, not just the headline number.
The long view in Park City
This year's 7% dip looks small next to the longer trend. The median Park City single-family home sold for $2.30M in 2020 and $3.80M today, a 65% increase in six years. For long-term owners, the equity story is still strong.
Park City median single-family price
Q3 2020–Q3 2026
Park City condos held their ground
Park City condos and townhomes moved the other way from single-family homes. Their median price rose 5% to $2.25M, even as new condo listings fell 42%. For buyers who want to be in town, condos remain the more accessible option, and they're holding their value.
Land is having a moment
Vacant land sales rose in every area on the Wasatch Back. Snyderville Basin sold 63% more lots than last year, and Heber Valley sold 36% more. Land prices rose too. The median lot price was up 22% in Snyderville Basin, 33% in Jordanelle and 38% in East Summit County. Lot buyers were active across the region.
Units sold, year over year. Park City sample size is small.
What this means for you
If you're selling
With fewer competing listings, a well-prepared, well-priced home stands out. Pricing still matters, since buyers are watching values closely in most areas. Getting it right from day one is how you take advantage of low inventory.
If you're buying
Choices are limited, so preparation counts. Get pre-approved, know your must-haves, and be ready to move. In areas where medians eased, there may be more room to negotiate than headlines suggest.
If you own
Even after this year's softening in some areas, most Wasatch Back owners have built significant equity in recent years. It's worth knowing where your home stands.
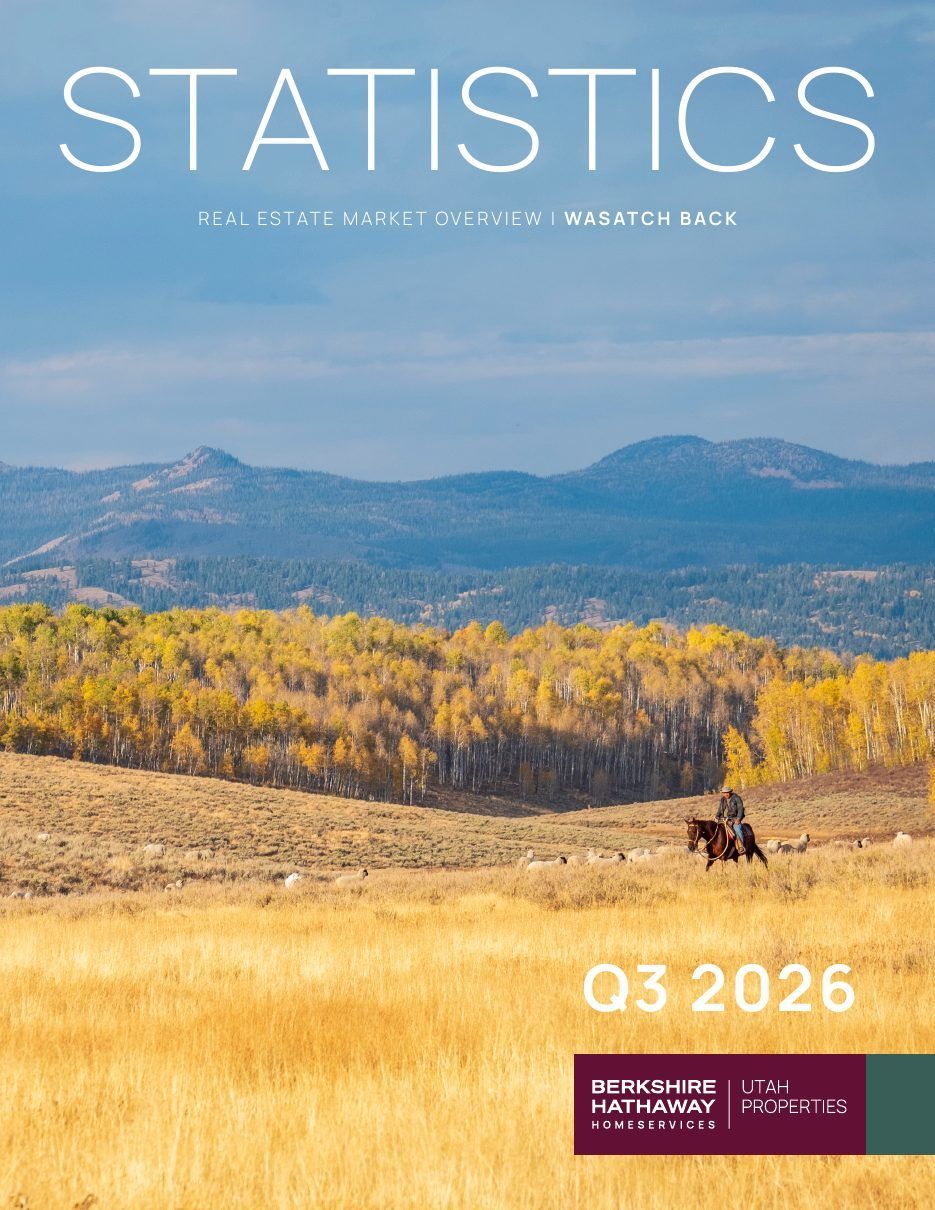
Get every number, area by area
The complete Q3 2026 Wasatch Back Statistics report from Berkshire Hathaway HomeServices Utah Properties covers 15 market segments across five areas:
- Single-family homes, condos & townhomes, and vacant land
- Park City, Snyderville Basin, Jordanelle, Heber Valley and East Summit County
- Active listings, new listings, pending and closed sales, sold volume, and average and median prices
- Six-year median price trends for every segment
Wasatch Back market questions
Are fewer homes coming on the market in Park City?
Yes. In Park City limits, new single-family listings fell 41% year over year, from 138 to 81. New single-family listings also fell in Snyderville Basin (-19%), Jordanelle (-52%), Heber Valley (-31%) and East Summit County (-22%).
What is the median home price in Park City right now?
The median single-family sale price in Park City limits was $3.80M for the 12 months ending September 30, 2026, down 7% from $4.06M a year earlier. The median for Park City condos and townhomes was $2.25M, up 5%.
Which Wasatch Back area saw the strongest single-family price growth?
Snyderville Basin. It was the only area where the median single-family price rose: up 9% to $2.70M. Units sold rose 8%, and total sold volume reached about $1.61 billion.
Are home prices in Heber Valley going up?
The Heber Valley median single-family price was $1.04M, down 4% year over year, with sales roughly flat (348 vs. 354). Vacant land in Heber Valley was stronger: units sold rose 36% and the median lot price rose 7%.
Where does this data come from?
All figures come from Park City Board of Realtors MLS data compiled by Berkshire Hathaway HomeServices Utah Properties. They compare the rolling 12 months from 10/1/25 to 9/30/26 with the prior 12 months. Some segments have small sample sizes.
What does this market mean for your home?
Every neighborhood tells its own story. We'll put together a custom report for your home or your search, with no pressure and no obligation.
Source: Park City Board of Realtors MLS data, rolling 12 months 10/1/25–9/30/26 compared with the prior 12 months, via Berkshire Hathaway HomeServices Utah Properties. Information not verified or guaranteed. Small sample sizes in some categories. ©2026 BHH Affiliates, LLC. An independently owned and operated franchisee of BHH Affiliates, LLC. Equal Housing Opportunity.