July 2026 Market Report
Park City & the
Wasatch Back
A month-by-month look at median prices, inventory, closings and days on market across every sub-market we serve — from Old Town to the Kamas Valley.
By Sub-Market
Where the numbers landed in July
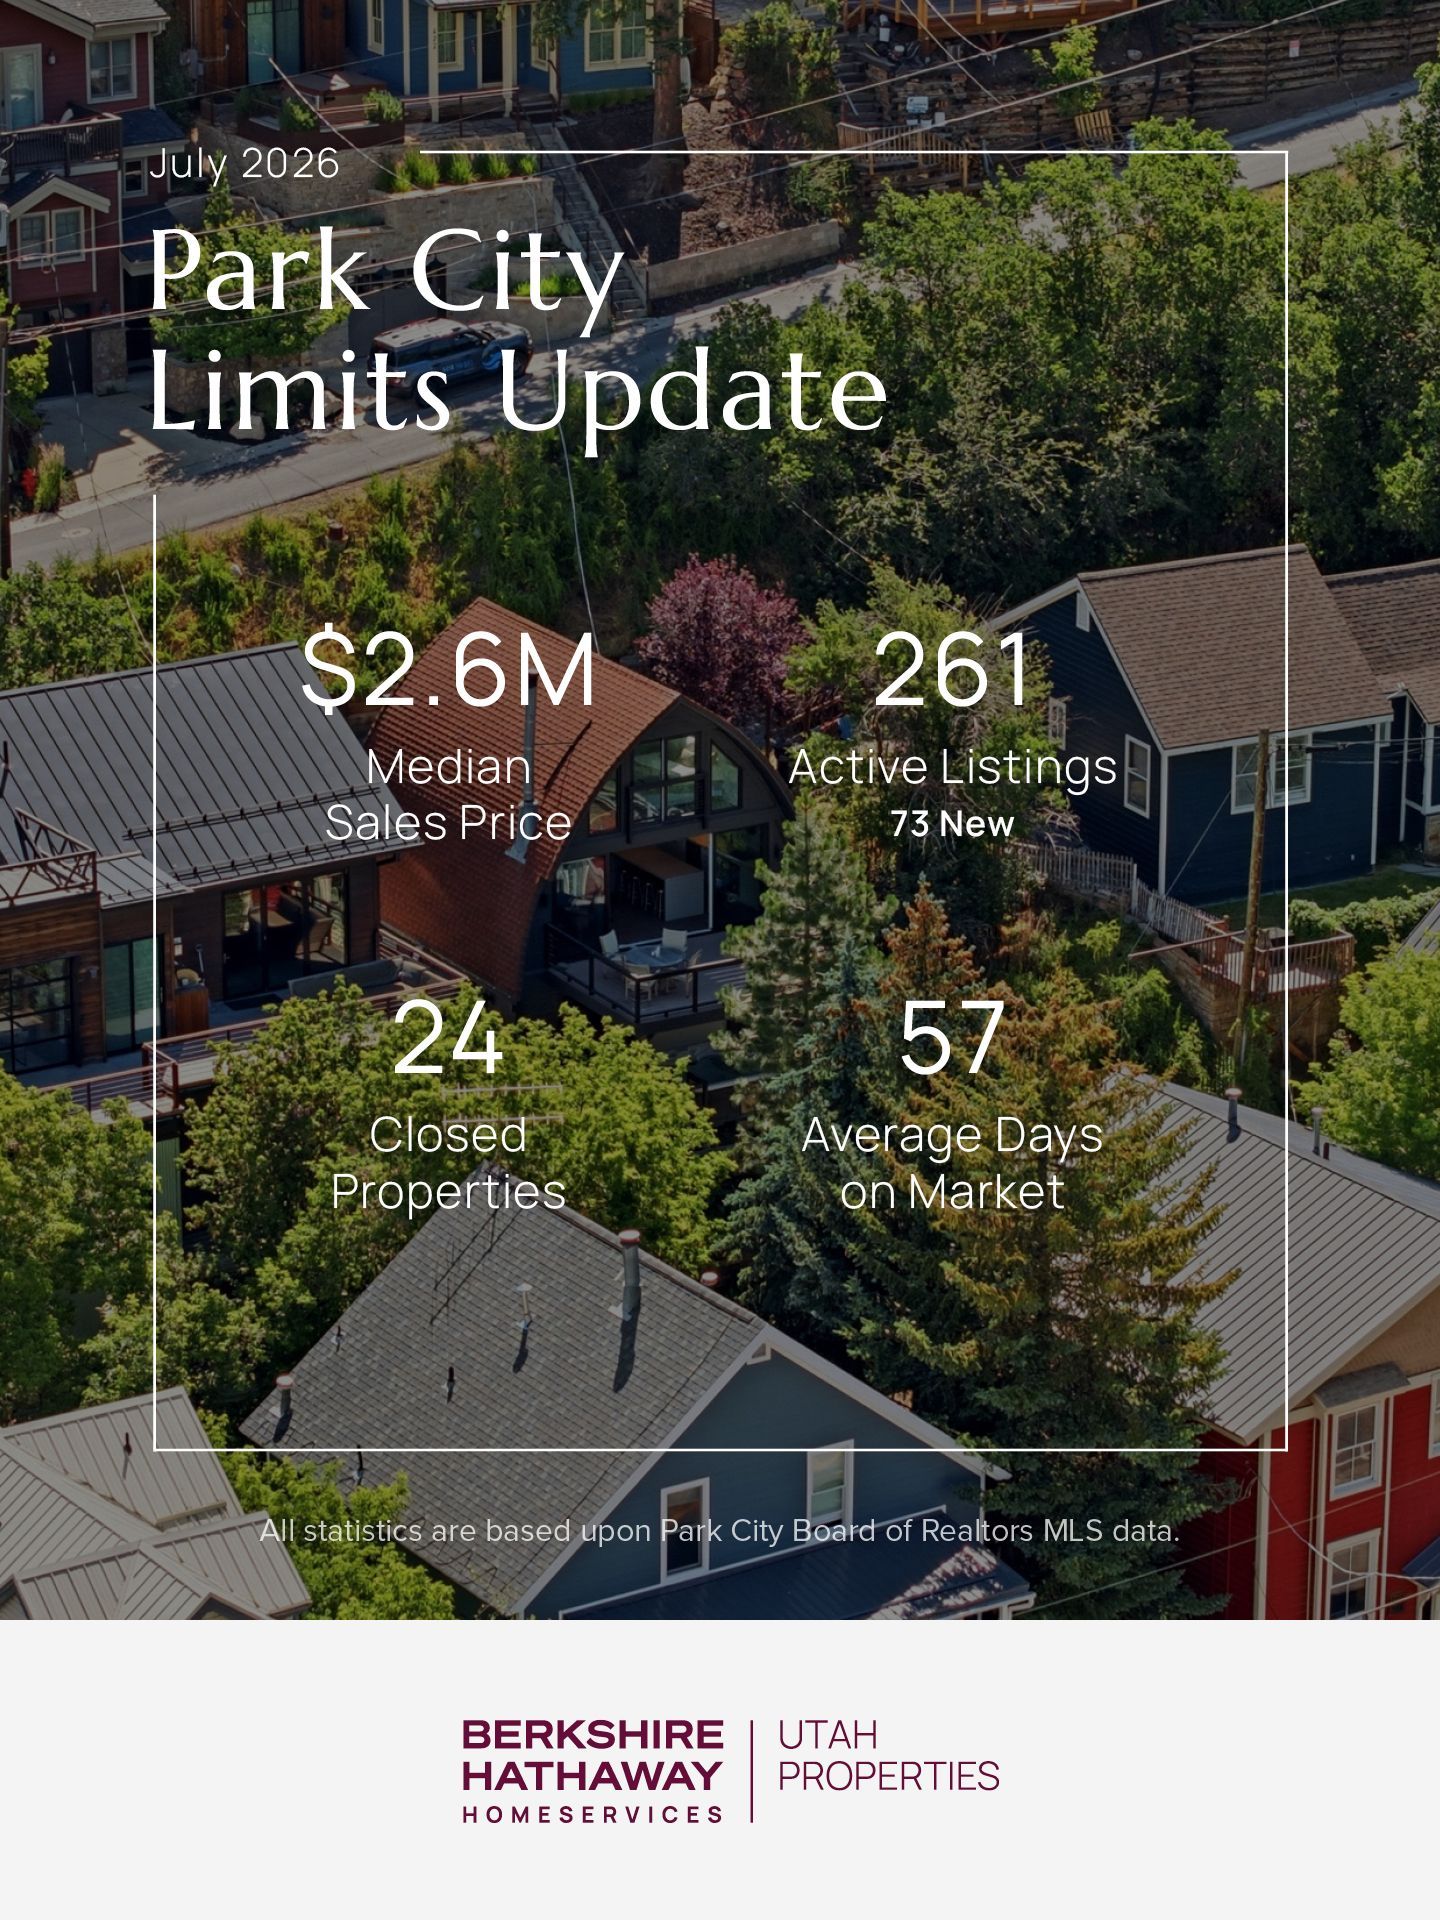
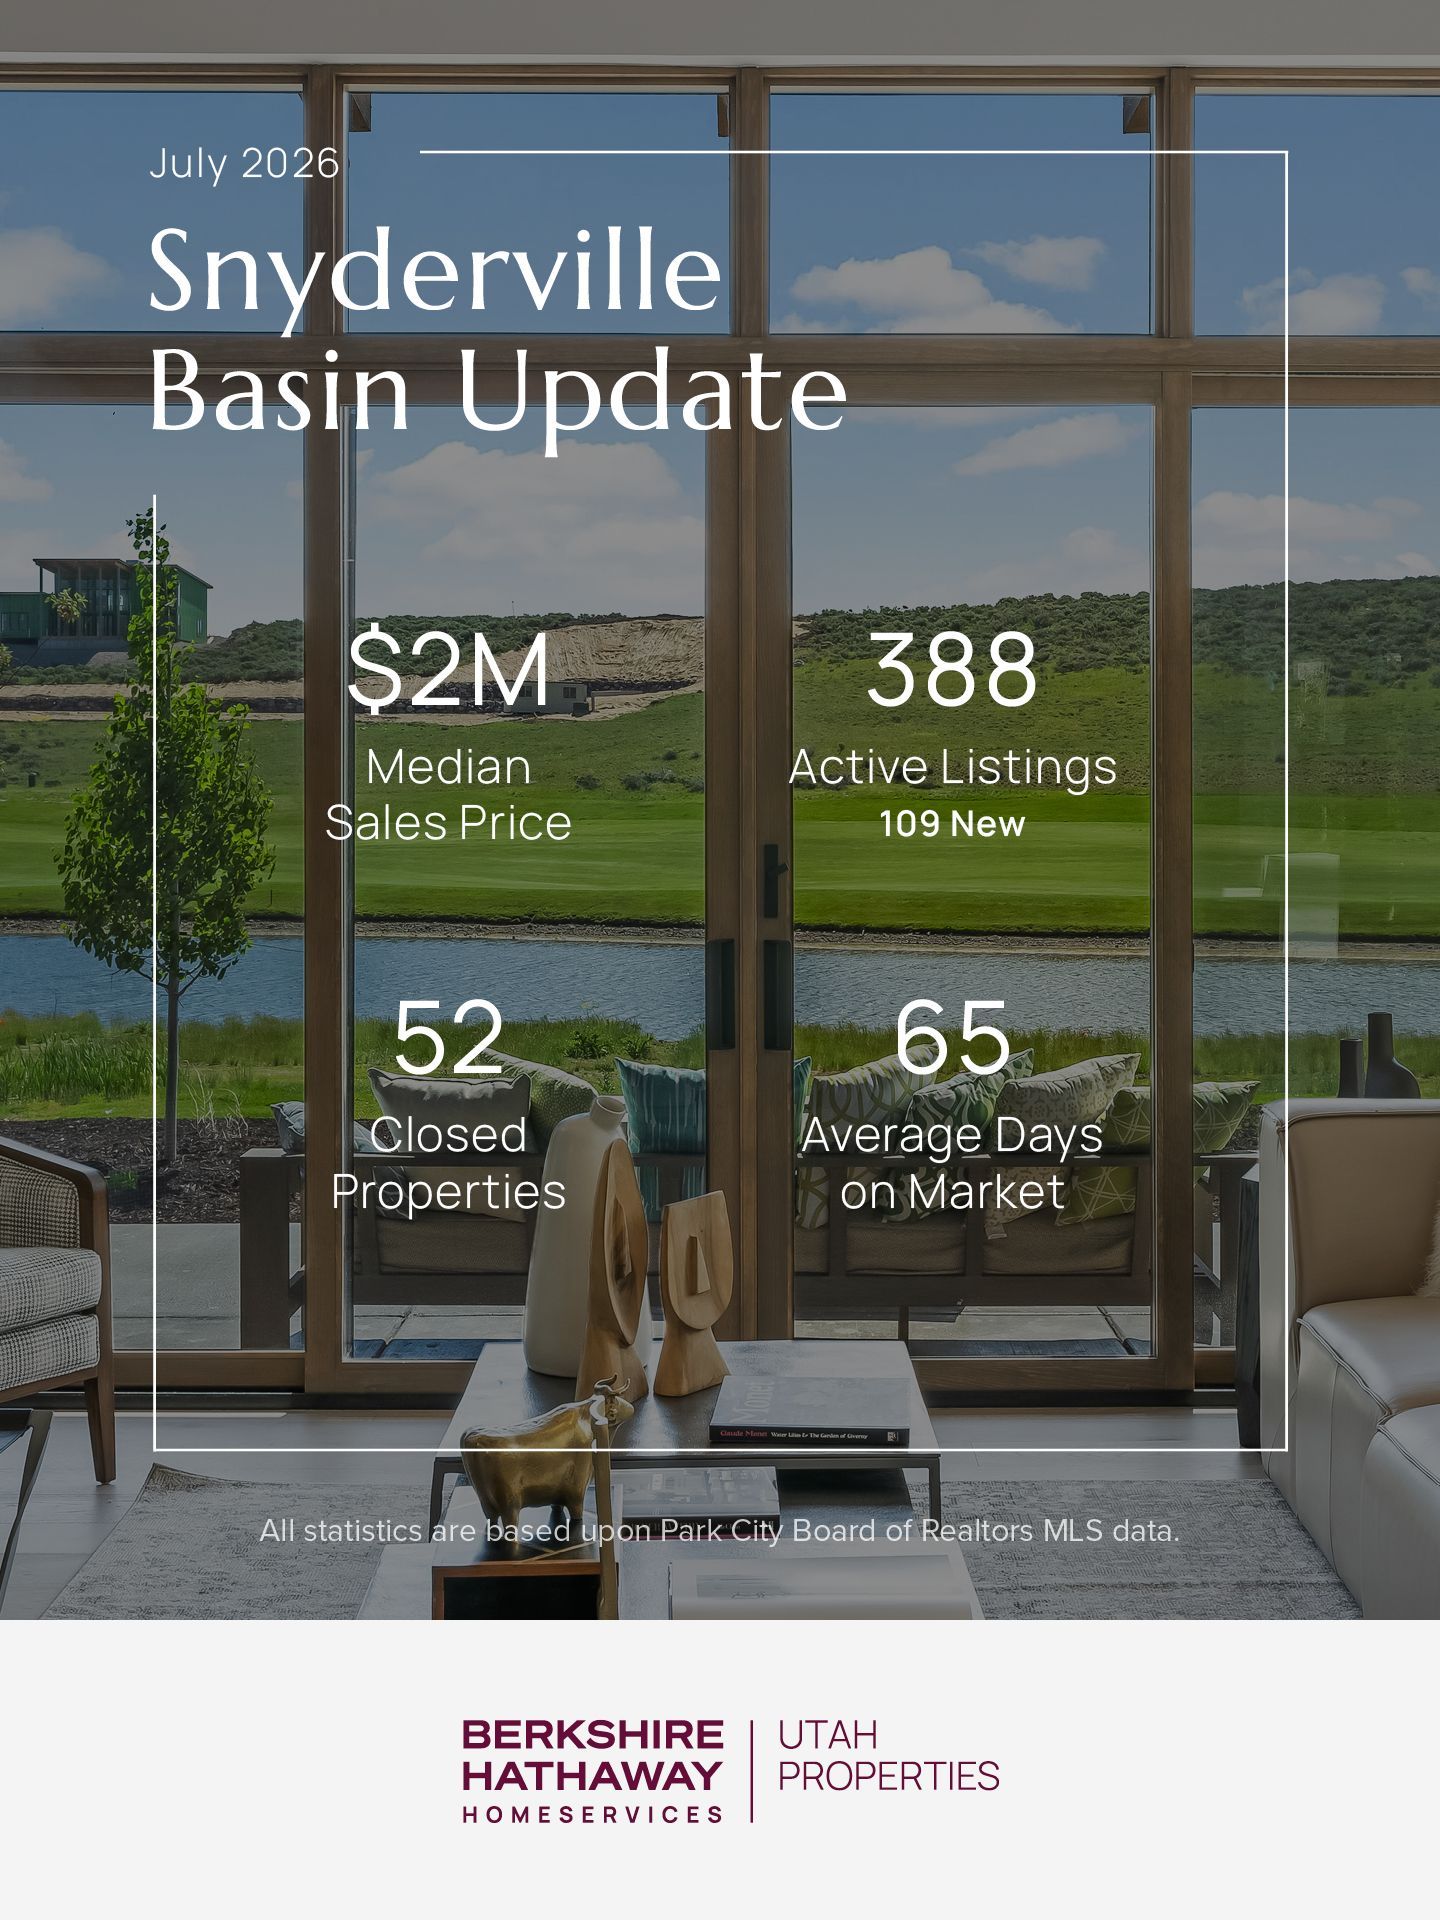
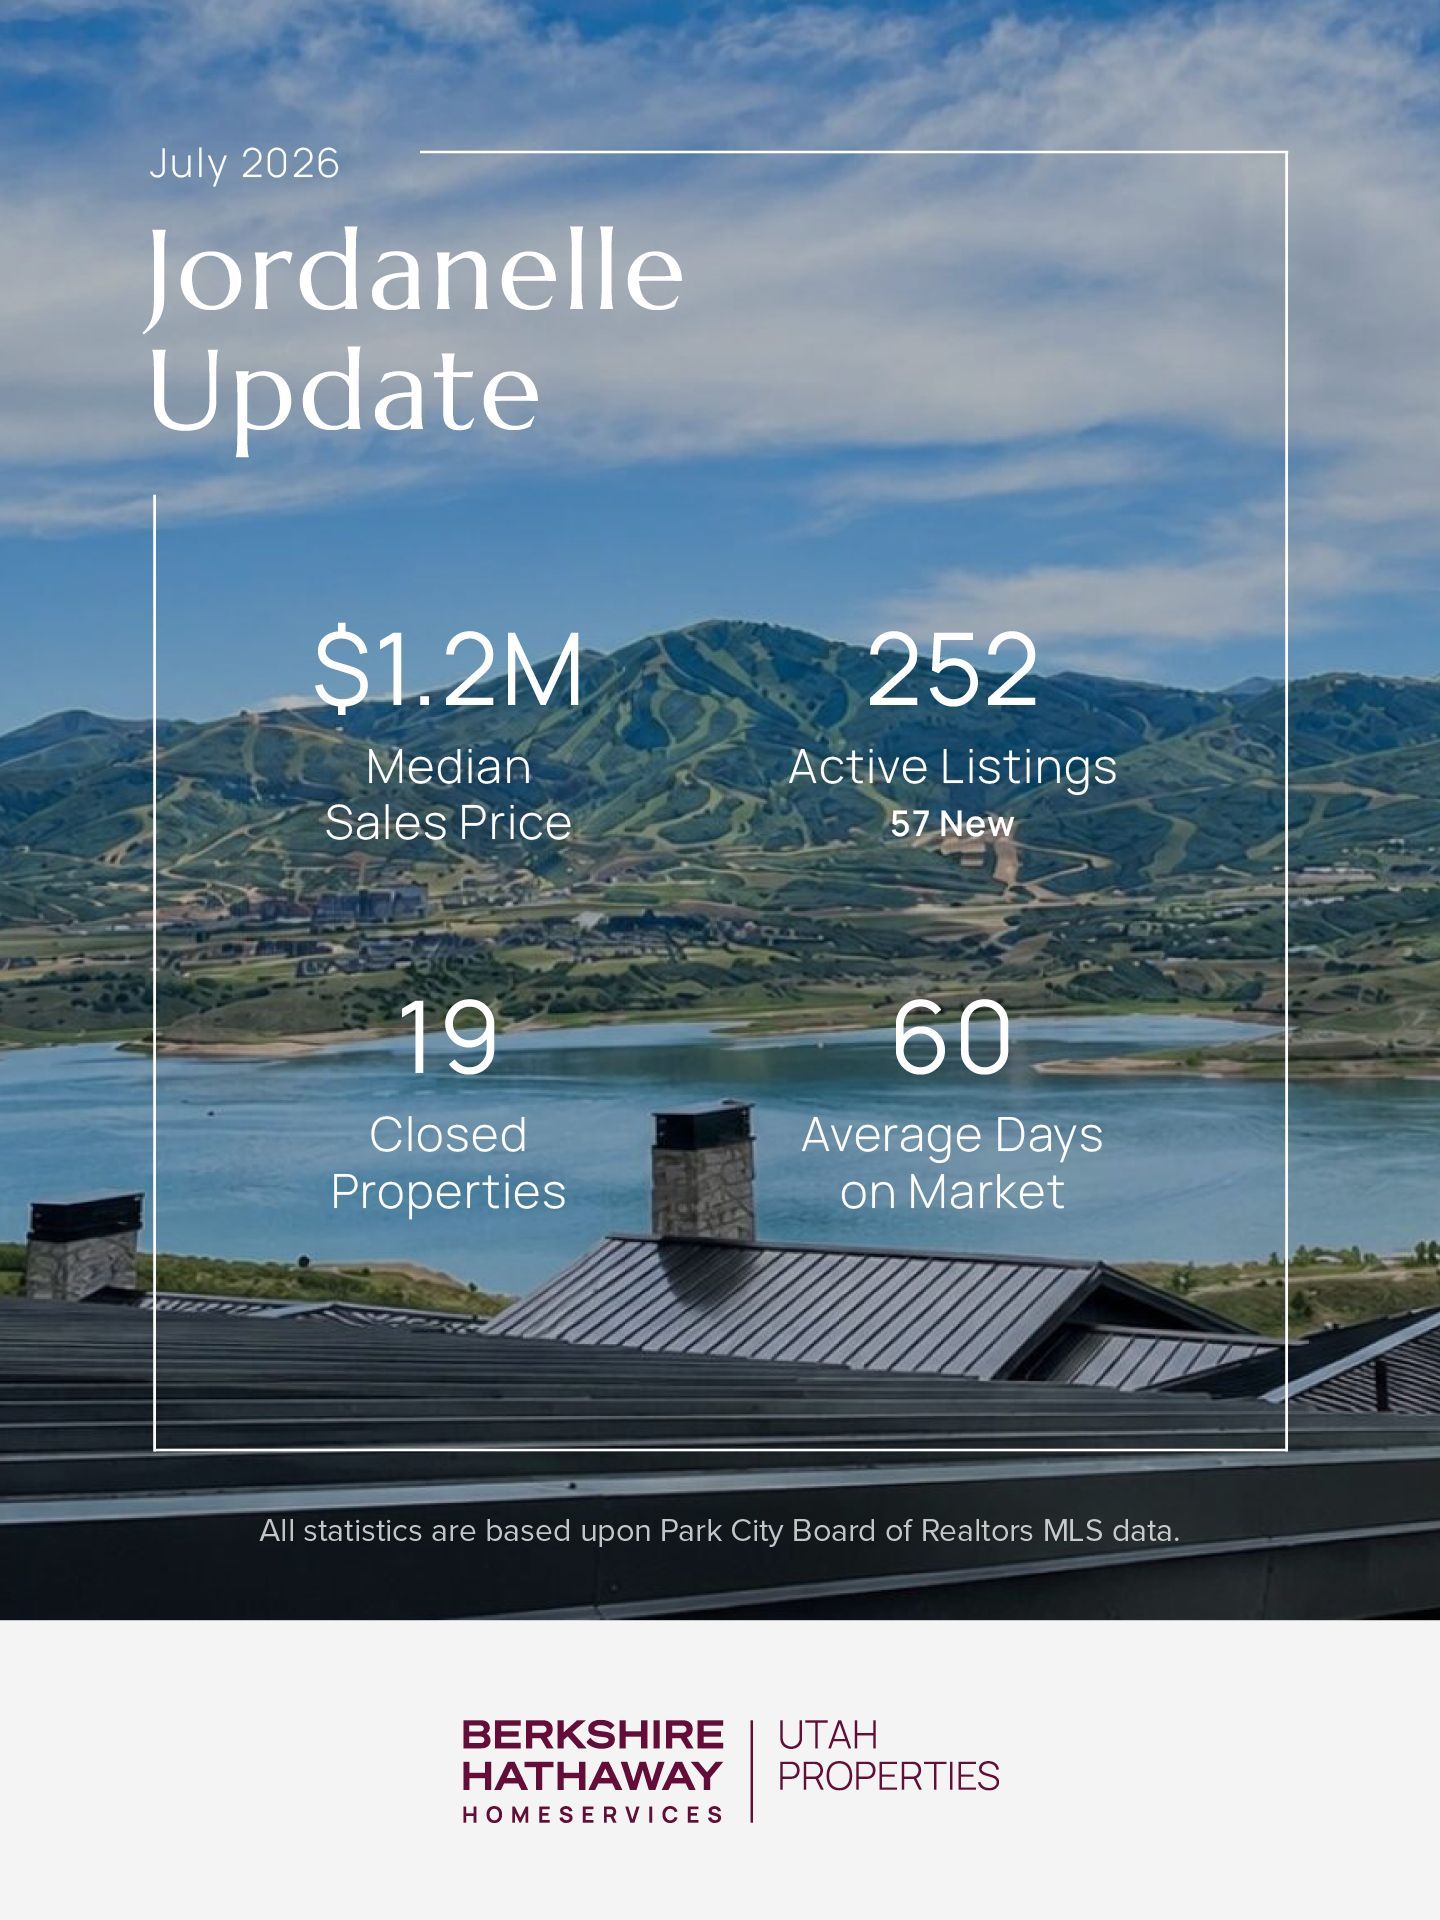
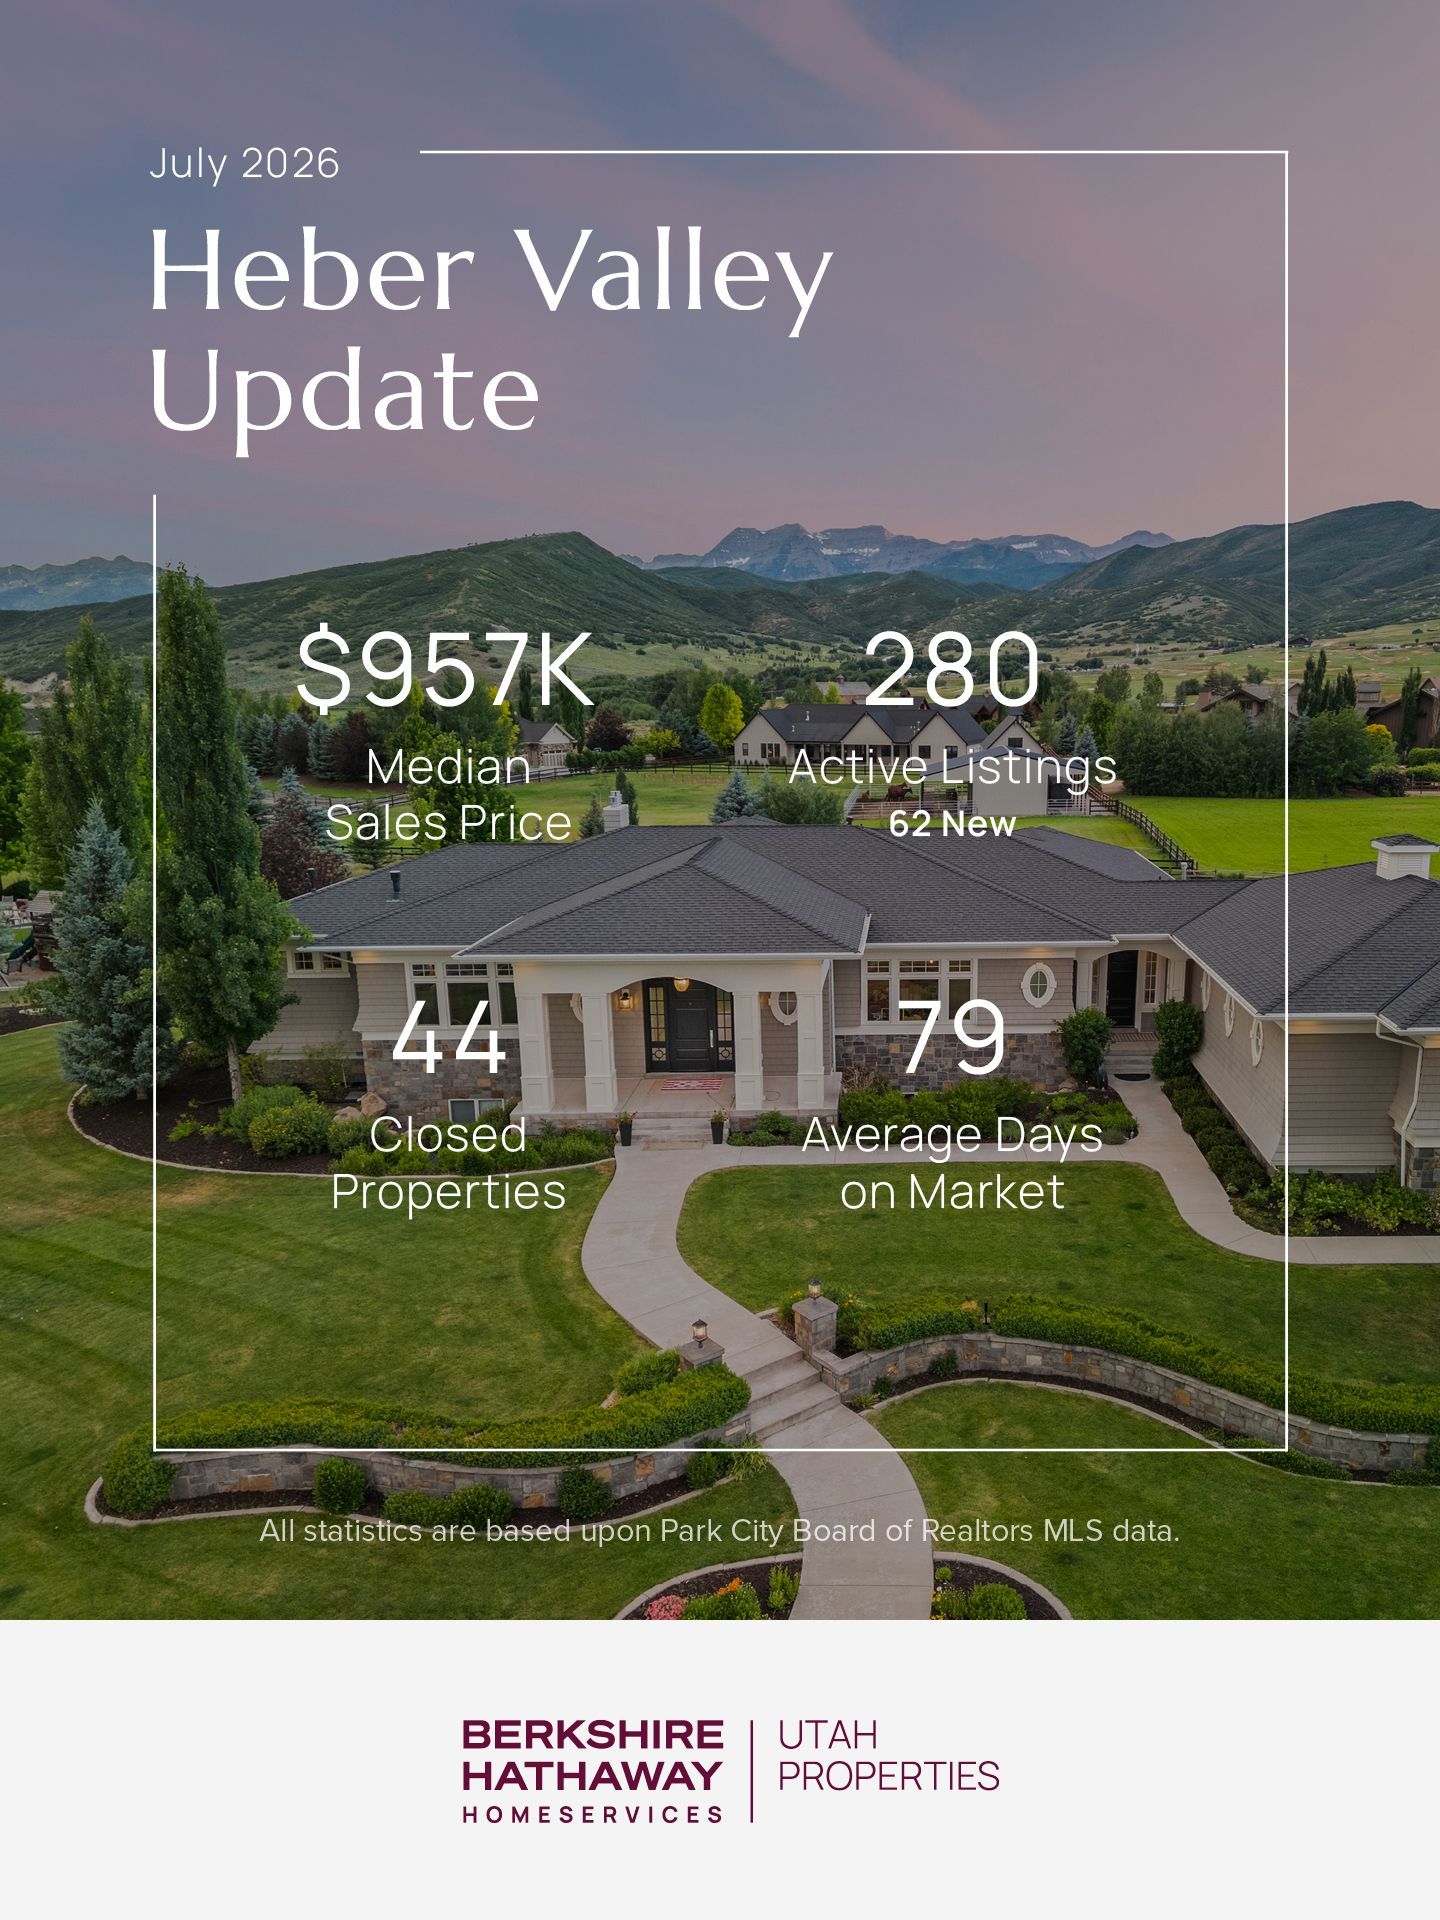
Each sub-market tells a different story. Inventory is up broadly, while days on market stayed tightest inside Park City limits.
Side by Side
Every market at a glance
| Sub-Market | Median Sales Price | Active Listings | Closed Properties | Avg. Days on Market |
|---|---|---|---|---|
| Park City Limits | $2.6M | 261 (73 new) | 24 | 57 |
| Snyderville Basin | $2M | 388 (109 new) | 52 | 65 |
| Jordanelle | $1.2M | 252 (57 new) | 19 | 60 |
| Heber Valley | $957K | 280 (62 new) | 44 | 79 |
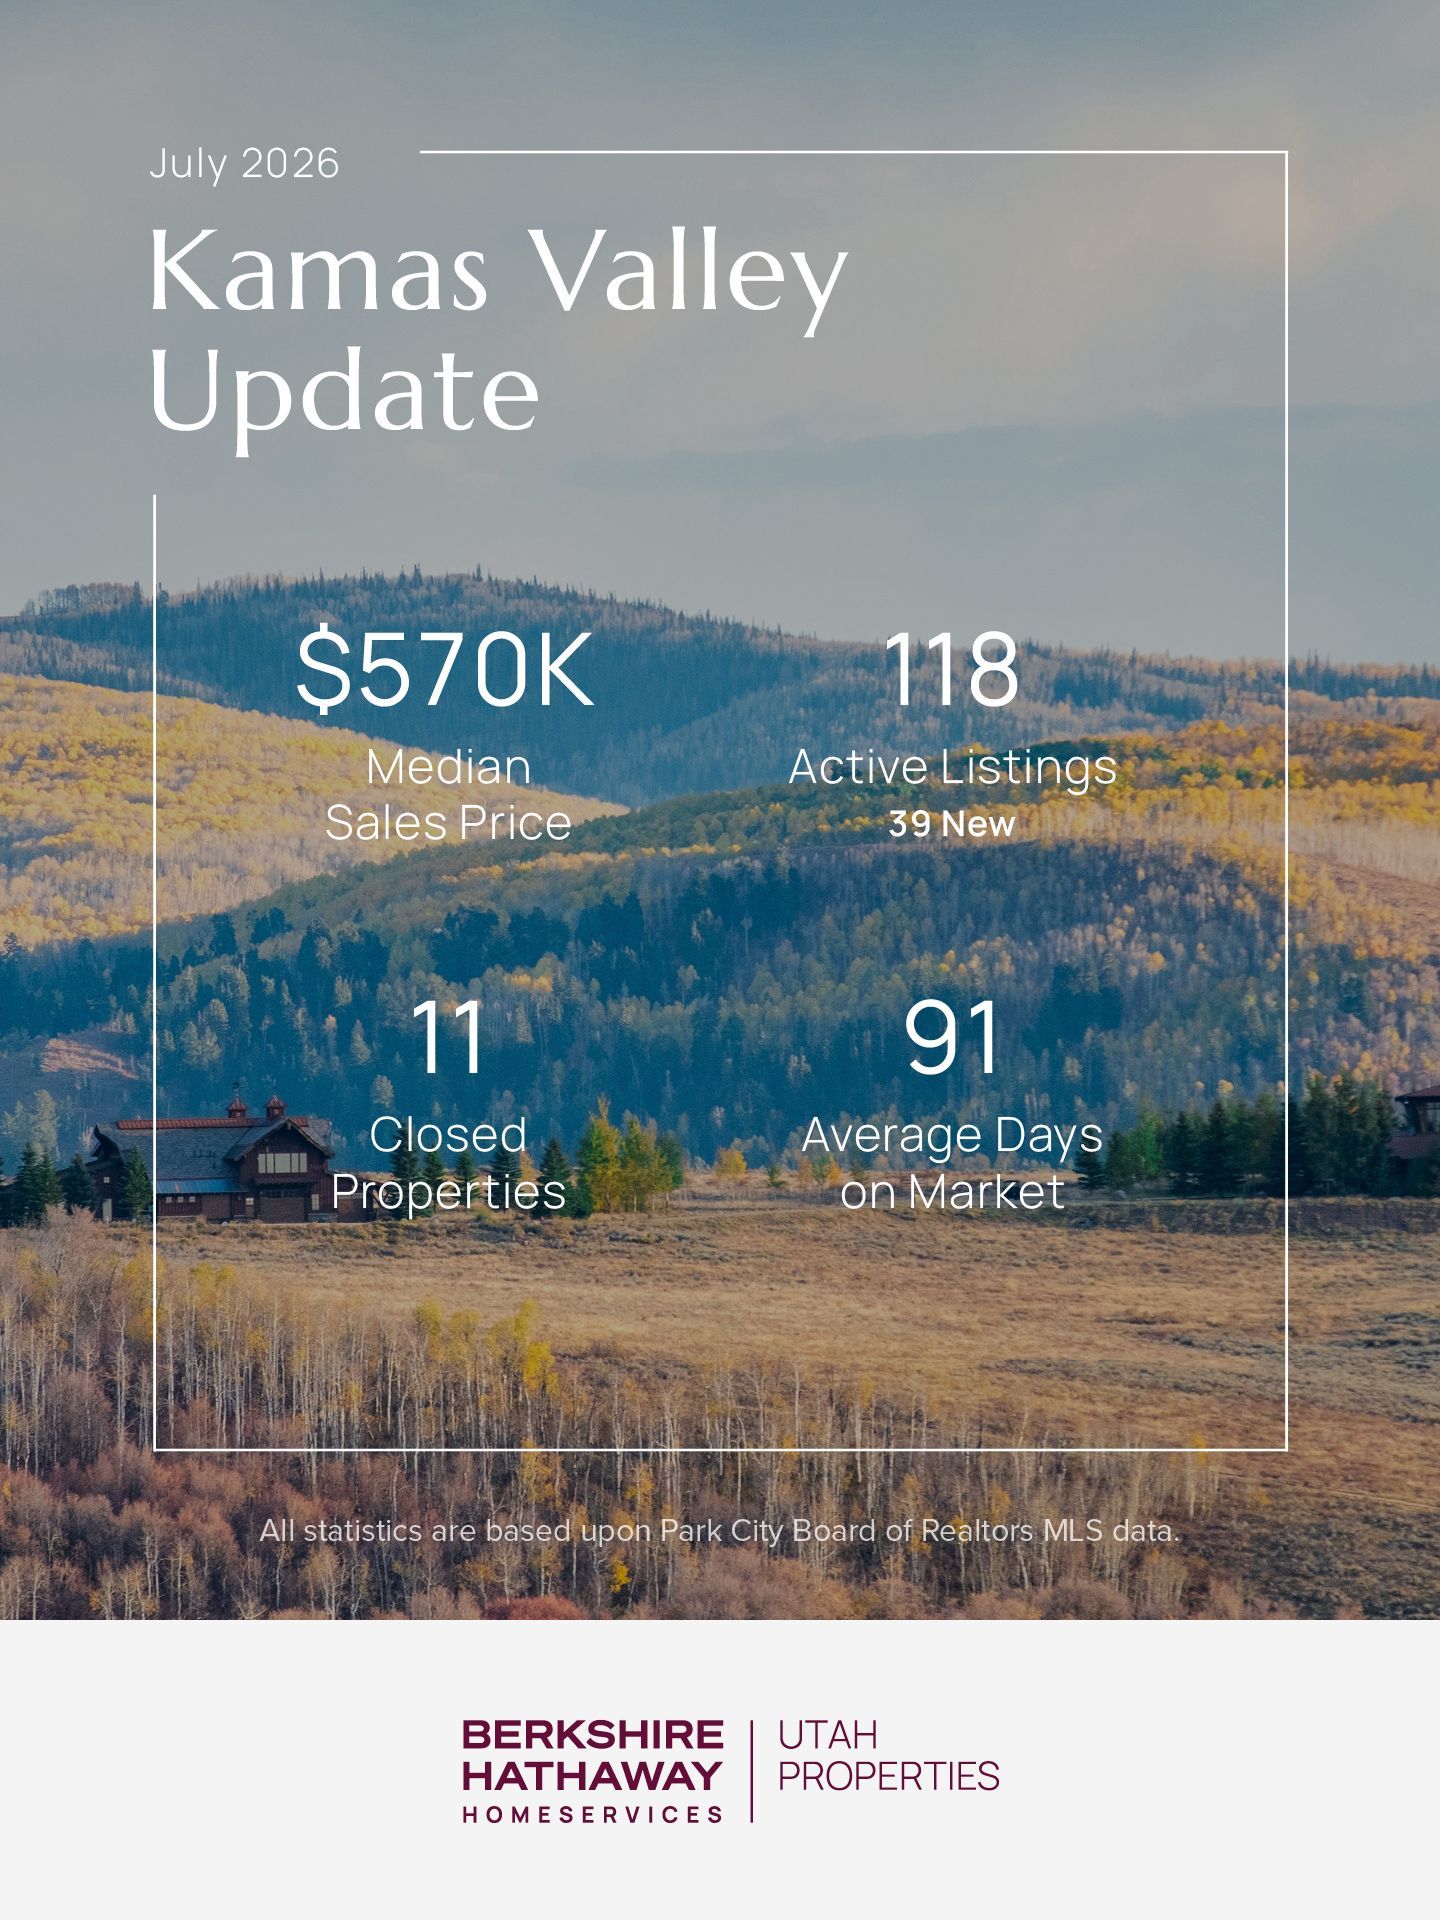
| Kamas Valley | $570K | 118 (39 new) | 11 | 91 |
| Summit County (all) | $1.9M | 779 (227 new) | 91 | 64 |
| Wasatch County (all) | $1M | 569 (124 new) | 66 | 78 |
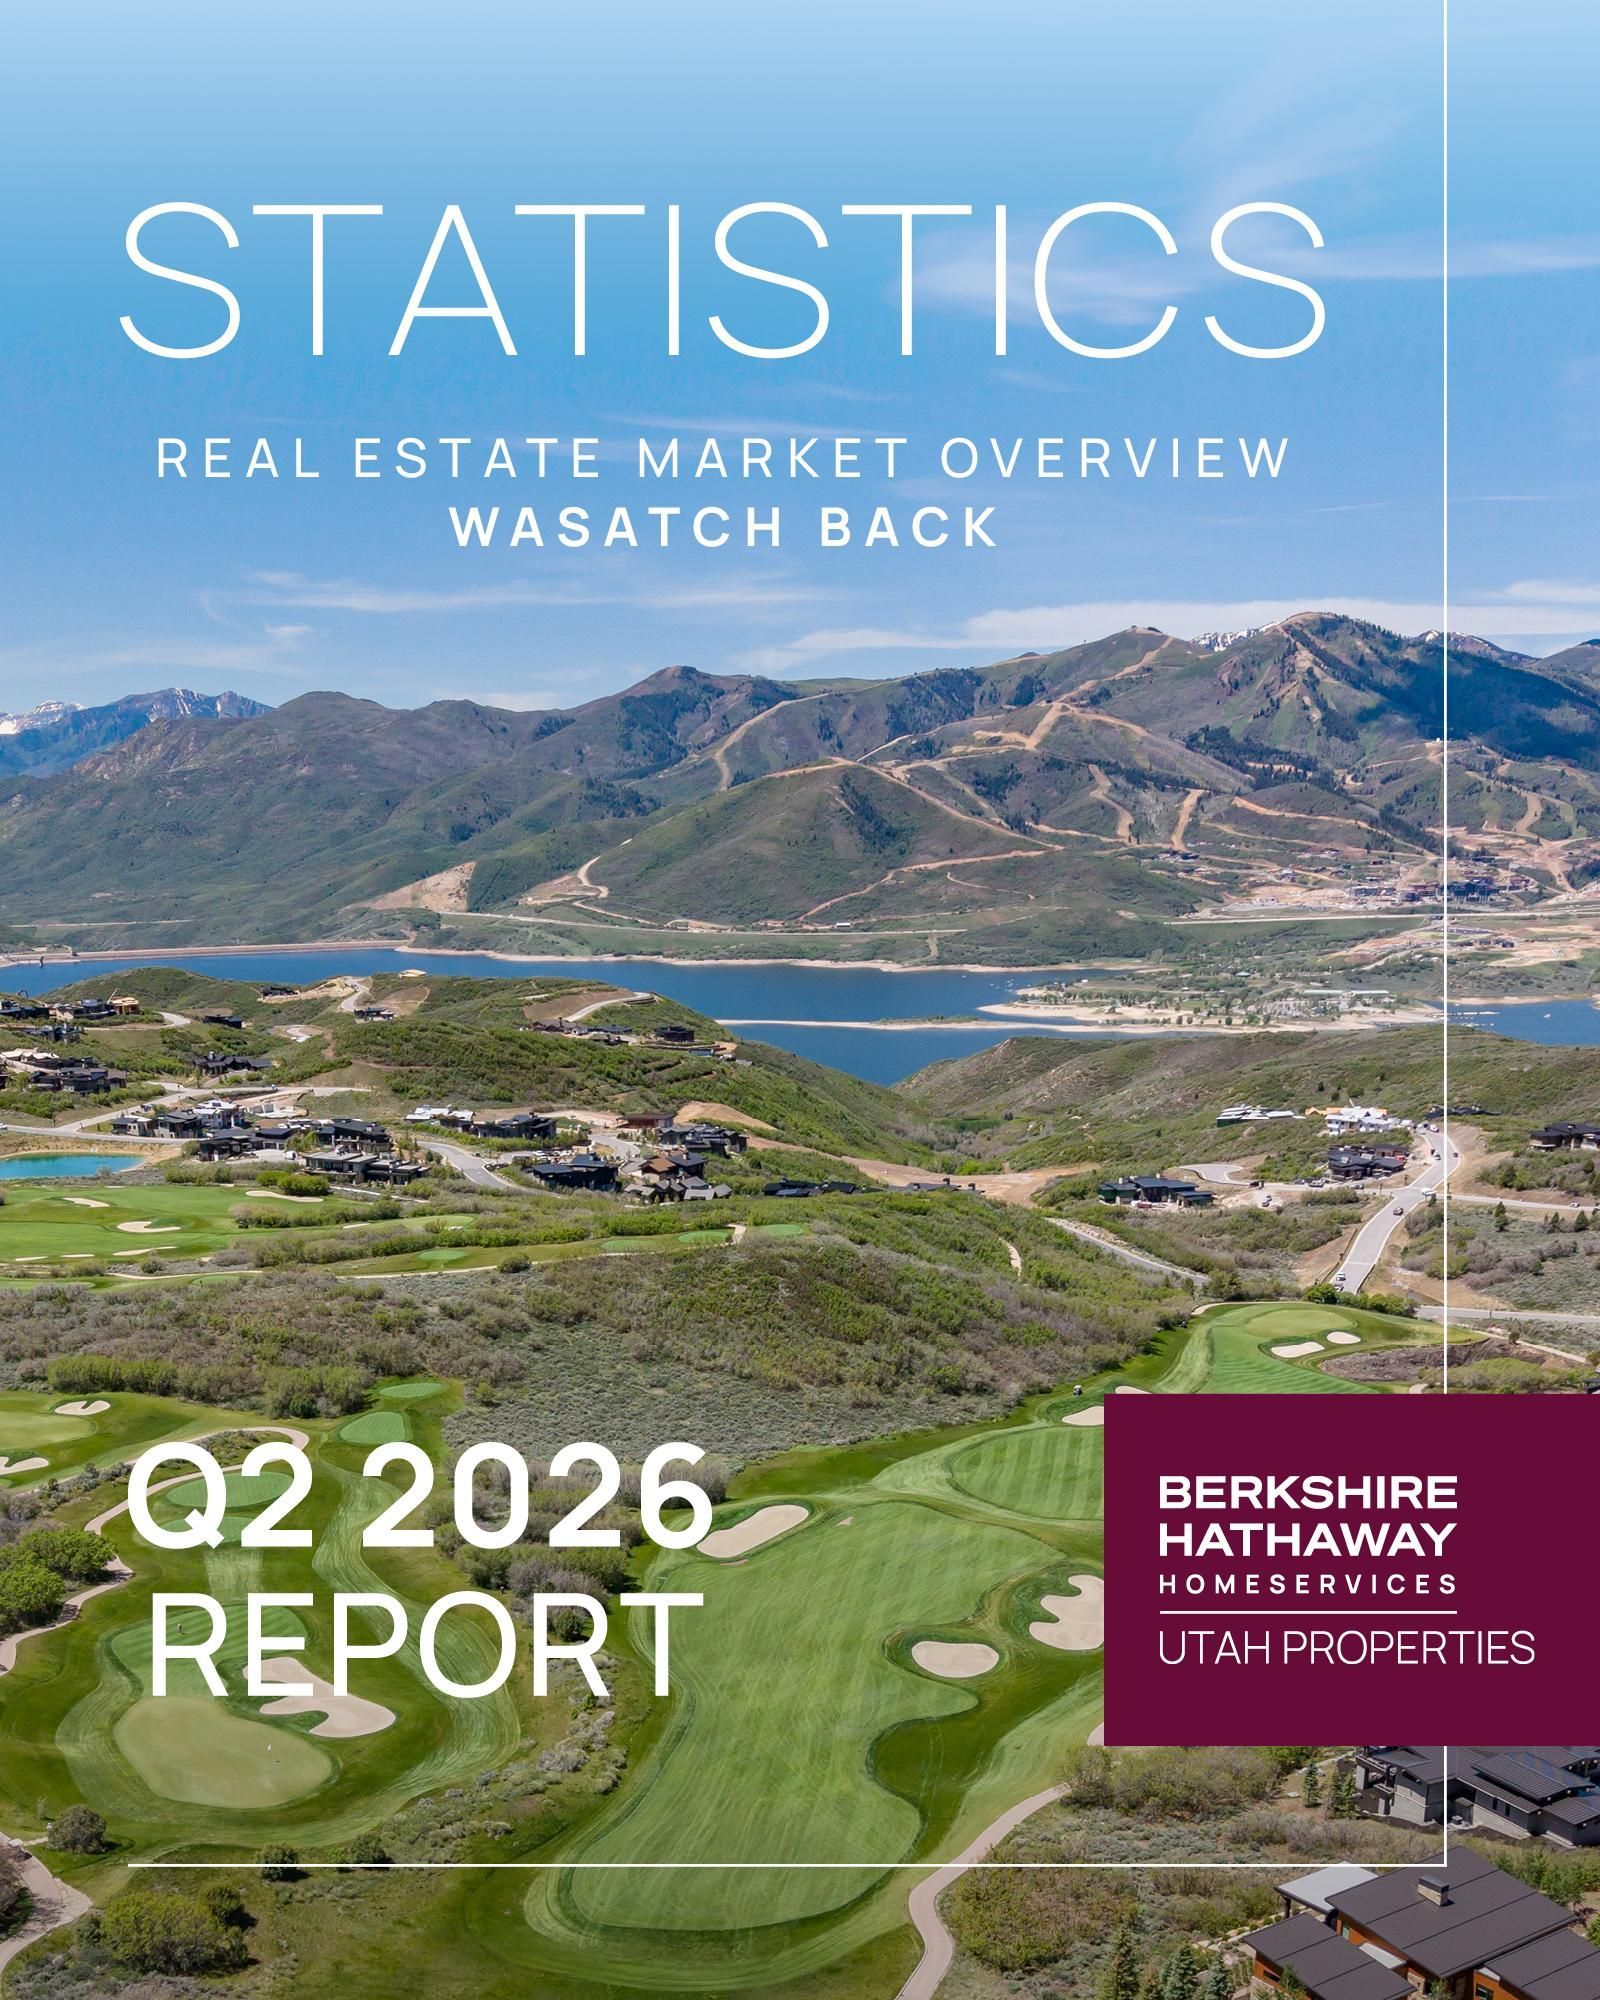
Get the full Q2 2026 report
Our quarterly Wasatch Back statistics magazine goes deeper than the monthly snapshot — price per square foot, sales volume and year-over-year trends for every sub-market we serve.